Case study · Fleet analytics

Electric Vehicles Battery Analysis

An EV motorcycle fleet runs on swappable batteries. Some of them quietly underperform. This project uses swap records and battery telemetry to flag the weak ones, explain what drives low usage, and forecast average usage for the next ten months, so a maintenance team knows where to look first.

The problem, the data, the goal

The question

Which batteries are underperforming?

In a battery-swap fleet, usage time between swaps is a practical proxy for battery health. A battery that needs swapping much sooner than its peers costs riders time and costs the operator money. The goal was to find those batteries, understand why they behave differently, and look ahead.

  • Identify batteries with low usage time
  • Use battery features to predict future usage patterns
  • Apply time series analysis to forecast battery life
The data

Two sources, joined

Swap data records each battery swap, including swap-in and swap-out times. Battery features data describes how each battery was operating: capacity, cycle count, state of charge (SOC), mileage, and temperature, among others.

Usage time between swaps was derived from the swap records, then grouped by battery ID and month. The usage distribution is heavily right-skewed: most batteries last 0 to 30 hours before needing a recharge, with a small number far above that.

From raw swaps to a forecast

Step 1

Flag low-usage batteries

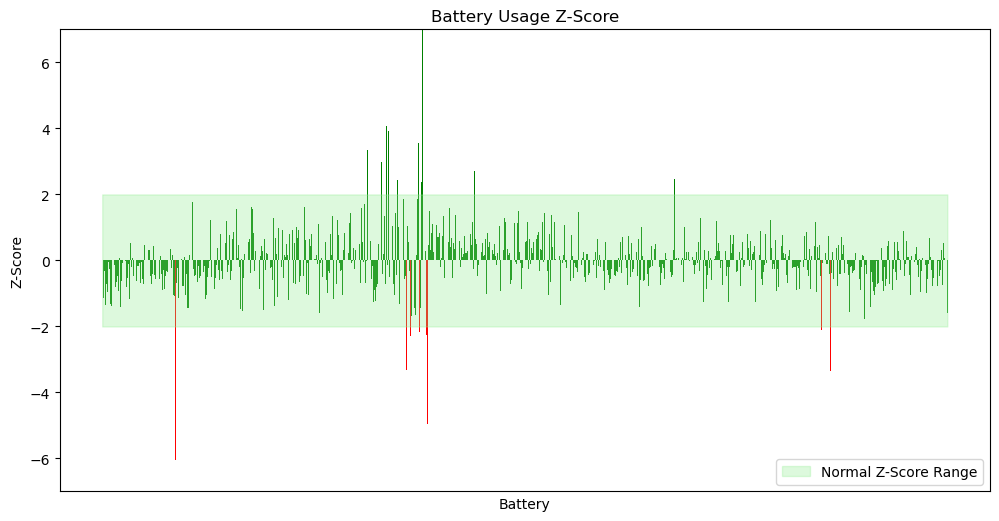
Average usage time was computed per battery and standardised as a z-score. Batteries more than two standard deviations below the fleet average were flagged as low-usage. A separate check flagged batteries whose monthly usage was trending down quickly.

Step 2

Integrate features

Swap data was merged with battery feature data so that usage time could be examined alongside the operating conditions behind it.

Step 3

Model usage time

Regression models predicted expected average usage time between swaps from these features, with a train/test split for validation. The notebook also explores clustering (KMeans).

  • Board surface temperature
  • Internal temperature
  • Cell series number
  • Mileage
  • Number of cycles
  • Battery SOC
  • Average speed
  • Total current
  • Total discharged capacity
  • Total voltage
  • Alarm flag
  • Battery capacity
  • Charge protect voltage

Step 4

Forecast with ARIMA

An ARIMA model captured the trend in average battery usage hours and produced a ten-month forecast, compared against historical values to judge reliability. The forecast is saved as a CSV in the repository.

What the analysis found

Out of the fleet, 22 batteries (1.36%) had a z-score below −2, meaning an unusually low average usage time, and 75 batteries (4.64%) showed a fast-declining trend.

Battery usage z-score chart. Most batteries fall within the shaded normal range from −2 to 2;
                red bars below −2 indicate unusually low usage.
Usage z-score for the full battery fleet. The shaded band marks the normal range; red bars fall below the low-usage threshold.
Low-usage batteries as a share of the fleet.
Z-score range among the 22 flagged batteries.

Drivers

What separates low-usage batteries

Comparing flagged batteries with the rest of the fleet, three features stood out:

  • Low total charged capacity
  • Low alarm-flag values (the AlarmDesc and AlarmFlag fields)
  • Low maximum charge current

Model quality

Prediction and forecast error

The regression model reached an MSE of 1.35 on test data. The ARIMA forecast reached a MAE of 4.34 against historical values. The ten-month forecast of average usage hours is available as a CSV in the repository.

Distribution of usage hours, all records.
The same distribution without outliers. Most batteries last 0 to 30 hours between recharges; the extreme cases above 50 hours may simply be idle batteries.

What the maintenance team can do

Charging

Check for overcharging

Flagged batteries had low charged capacity, which may point to overcharging affecting performance. This is a hypothesis worth testing, not a confirmed cause. The team should make sure batteries are charged within their specific limits.

Monitoring

Act on alarm flags early

Pay closer attention to alarm flags and resolve issues as soon as they appear.

Hardware

Match chargers to batteries

Keep each charging system's maximum current rating at or below the battery's recommended charge current.

Where I would take it next

Caveats

What to keep in mind

  • Very long usage times can reflect idle batteries rather than healthy ones.
  • The data was aggregated, which limits how reliable the models can be.

Next steps

Improving the models

  • Use more granular data to improve reliability
  • Run feature importance analysis and feature selection
  • Extend the time series model to predict long-term battery life

What is in the repository

Stack

Python, pandas, NumPy, SciPy, scikit-learn, statsmodels (ARIMA), matplotlib, Jupyter

Analysis

Main notebook covering extraction, cleaning, EDA, modelling and forecasting, plus a script version and a slide deck for non-technical readers

Outputs

CSVs of low-usage batteries, fast-declining batteries, and the ten-month predicted average usage